Tracing and Other Telemetry With OpenTelemetry
This page explains how to implement logging, tracing and metrics using OpenTelemetry.
Enabling OpenTelemetry
To enable OpenTelemetry for an application consists of the following steps:
-
Add the Lightbend Telemetry ("Cinnamon") dependencies:
<dependency>
    <groupId>com.lightbend.cinnamon</groupId>
    <artifactId>cinnamon-opentracing-zipkin</artifactId>
</dependency>
<dependency>
    <groupId>com.lightbend.cinnamon</groupId>
    <artifactId>cinnamon-opentracing_${scala.version}</artifactId>
</dependency>
<dependency>
    <groupId>com.lightbend.cinnamon</groupId>
    <artifactId>cinnamon-agent</artifactId>
</dependency>
Starting from IPF 2024.2.0, there is a workaround required to avoid a clash between library versions. Please add the following to the
<dependencyManagement>block of your rootpom.xmlto use OTel and OpenTracing together:<dependency> <groupId>io.opentracing</groupId> <artifactId>opentracing-util</artifactId> <version>0.33.0</version> </dependency> <dependency> <groupId>io.zipkin.reporter2</groupId> <artifactId>zipkin-sender-urlconnection</artifactId> <version>2.16.3</version> </dependency> <dependency> <groupId>io.zipkin.reporter2</groupId> <artifactId>zipkin-reporter</artifactId> <version>2.16.3</version> </dependency> <dependency> <groupId>io.zipkin.zipkin2</groupId> <artifactId>zipkin</artifactId> <version>2.23.2</version> </dependency> -
Enable the Lightbend Telemetry Java Agent e.g. in the
CMDsection of the Docker image:exec java -javaagent:/${project.artifactId}/lib/com.lightbend.cinnamon-cinnamon-agent-${cinnamon.version}.jarThis is already done as part of the Icon Project Archetype so this step is usually not required -
Enable the relevant metric or event exporters as per Lightbend Telemetry OpenTelemetry docs for metrics, events, logs.
-
To enable tracing, ensure the OpenTelemetry Collector is configured to receive OpenTracing-formatted spans, and follow the instructions in Zipkin reporter.
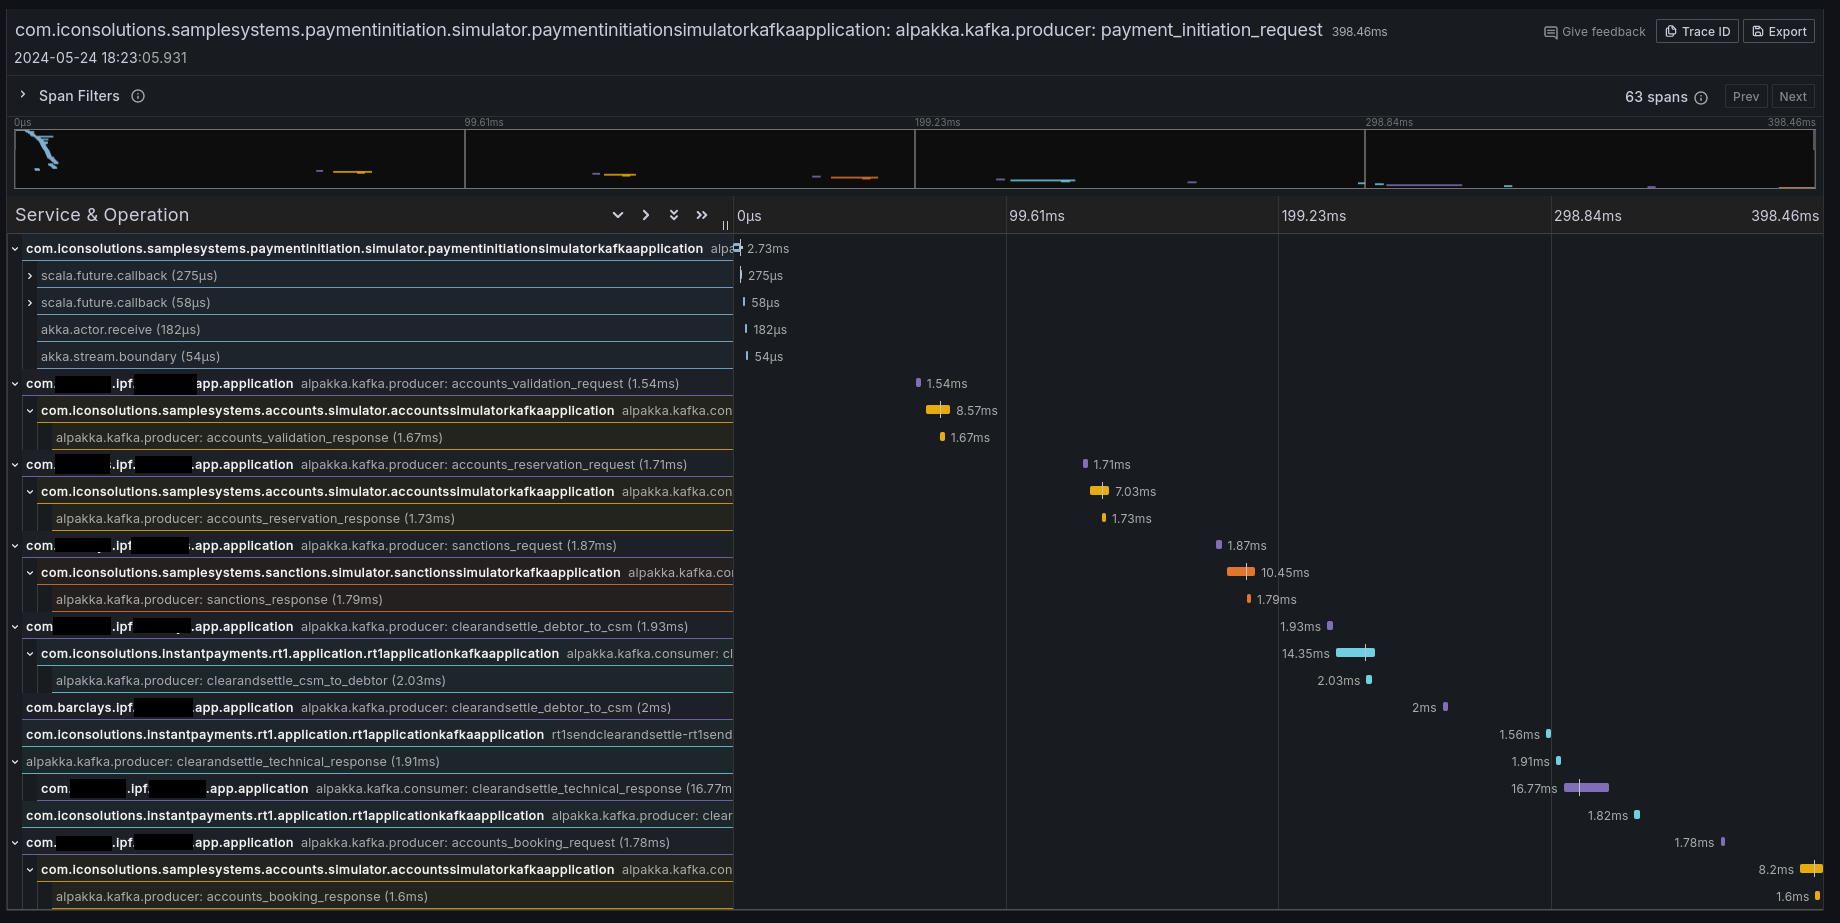
If it all worked correctly then you should see some traces in your preferred tracing tool (e.g. Jaeger, Zipkin, Grafana Tempo):
Context Propagation
It is also possible to configure IPF to simply propagate the relevant headers without creating any additional tracing information. By default, Lightbend Telemetry supports forwarding the following types of context:
| Type | Docs to enable |
|---|---|
W3C Trace Context (default for OpenTelemetry) |
|
B3 (by Zipkin) |
|
AWS X-Ray |
Limitations
Tracing and telemetry in general are generally a zero-code approach: simply enabling the Cinnamon Java agent enables code-level introspection to add the relevant tracing details.
However, Lightbend Telemetry currently only supports Kafka and HTTP. If - at any boundary - messages are going over JMS (or any other protocol that isn’t Kafka or HTTP), the trace context will be lost, and some intervention is required to connect the traces.
To connect the traces, follow the instructions in Inject and Extract
to extract the SpanContext when sending, and injecting it when receiving messages. An example using a modified a
custom CorrelationService could be:
import com.iconsolutions.ipf.core.shared.correlation.CorrelationService;
import lombok.AllArgsConstructor;

@AllArgsConstructor
public class OpenTracingAwareCorrelationService implements CorrelationService {

    private final CorrelationService delegate;

    @Override
    public CompletionStage<Correlation> save(Correlation correlation) {
        var map = new HashMap<String, String>();
        GlobalTracer.get().inject(ActiveSpan.getContext(), Format.Builtin.TEXT_MAP, new TextMapAdapter(map));
        correlation.getSupportingContext().mergedWith(SupportingContext.of(map));
        return delegate.save(correlation);
    }

    @Override
    public CompletionStage<Optional<Correlation>> findByCorrelationId(CorrelationId correlationId) {
        return delegate.findByCorrelationId(correlationId)
                .thenApply(maybeCorrelation -> {
                    maybeCorrelation.ifPresent(it -> GlobalTracer.get().extract(Format.Builtin.TEXT_MAP, new TextMapAdapter(it.getSupportingContext().getMetaData().getValues())));
                    return maybeCorrelation;
                });
    }
}
This CorrelationService implementation will save the active OpenTracing Span into the correlation store where
possible, and extract it where possible.
Note that this will require introducing a dependency on OpenTracing, which is a library that is deprecated in favour of OpenTelemetry. This page will be updated when Lightbend Telemetry is updated to support native OpenTelemetry tracing.
Lightbend Telemetry ("Cinnamon") support for tracing
Lightbend Telemetry ("Cinnamon") does not currently support the OpenTelemetry standard for traces and only implements the legacy OpenTracing API. However, the OpenTelemetry collector and AWS X-Ray support the legacy OpenTracing Zipkin format. So you shouldn’t need to do anything else to get traces working in OpenTelemetry.
No configuration should be needed aside from just adding the libraries in step 1, but Click here to see what configuration is available to tweak in the library.
Combining OpenTelemetry and OpenTracing
You may have a requirement to propagate the trace context between OpenTelemetry and OpenTracing. For example, if the following combination applies:
-
You are using the OpenTelemetry Java Agent
-
You are starting a flow from a Spring
@RestController,@KafkaListener,@JmsListener, or similar -
You are receiving a trace context in the form of headers from an upstream system or broker
By default, the trace will break between the Spring side and IPF side, because Lightbend Telemetry (and by extension Akka and IPF) uses the OpenTracing API, and will not be aware of the OTel trace context that was populated by Spring. The context needs to be manually propagated from OTel to OpenTracing; follow these steps to set up your application to connect the trace context between OTel and OpenTracing:
-
Add the Lightbend Telemetry agent first and OTel agent second:
-javaagent:/path/to/cinnamon-agent-2.20.1.jar -javaagent:/path/to/opentelemetry-javaagent.jar -
Disable OTel Akka and Akka HTTP instrumentation with the system properties (or environment variables, or config file entries):
otel.instrumentation.akka-http.enabled=false otel.instrumentation.akka.enabled=false -
Make sure the values of
otel.service.nameandcinnamon.applicationare the same, so that traces appear to come from the same IPF application (unless if you want them to be different)Default values:
-
cinnamon.application: fully qualified name of where JVM was started in lowercase, e.g.com.mycorp.application -
otel.service.name:unknown_service:java
-
-
When going from the Spring message consumer or REST controller, inject the OTel context into a map and extract it into OpenTracing:
@PostMapping(value = "/submit")
public CompletionStage<ResponseEntity<Void>> helloMapping(@RequestHeader Map<String, String> headers, @RequestBody String number) {
    //make an empty map to transport the context
    var otelContext = new HashMap<String, String>();
    //put the OTel Context into the map
    GlobalOpenTelemetry.get().getPropagators().getTextMapPropagator().inject(Context.current(), otelContext, (carrier, key, value) -> carrier.put(key, value));
    //put the map's contents into an OpenTracing SpanContext
    var openTracingContext = GlobalTracer.get().extract(Format.Builtin.TEXT_MAP, new TextMapAdapter(otelContext));
    //set the new OpenTracing SpanContext to be the current one
    GlobalExtendedTracer.get().local().activateContext(openTracingContext);

    //call IPF
    return MyDomain.initiation().handle(new InitiateMyFlowInput.Builder().build())
        .thenCompose(__ -> ResponseEntity.accepted().build);
}