Tracing and Other Telemetry With OpenTelemetry
This page explains how to implement logging, tracing and metrics using OpenTelemetry.
Enabling OpenTelemetry
To enable OpenTelemetry for an application consists of the following steps:
-
Add the Lightbend Telemetry ("Cinnamon") dependencies:
<dependency> <groupId>com.lightbend.cinnamon</groupId> <artifactId>cinnamon-opentracing-zipkin</artifactId> </dependency> <dependency> <groupId>com.lightbend.cinnamon</groupId> <artifactId>cinnamon-opentracing_${scala.version}</artifactId> </dependency> <dependency> <groupId>com.lightbend.cinnamon</groupId> <artifactId>cinnamon-agent</artifactId> </dependency> -
Enable the Lightbend Telemetry Java Agent e.g. in the
CMDsection of the Docker image:exec java -javaagent:/${project.artifactId}/lib/com.lightbend.cinnamon-cinnamon-agent-${cinnamon.version}.jarThis is already done as part of the Icon Project Archetype so this step is usually not required -
Enable the relevant metric or event exporters as per Lightbend Telemetry OpenTelemetry docs for metrics, events, logs.
-
To enable tracing, ensure the OpenTelemetry Collector is configured to receive OpenTracing-formatted spans, and follow the instructions in Zipkin reporter.
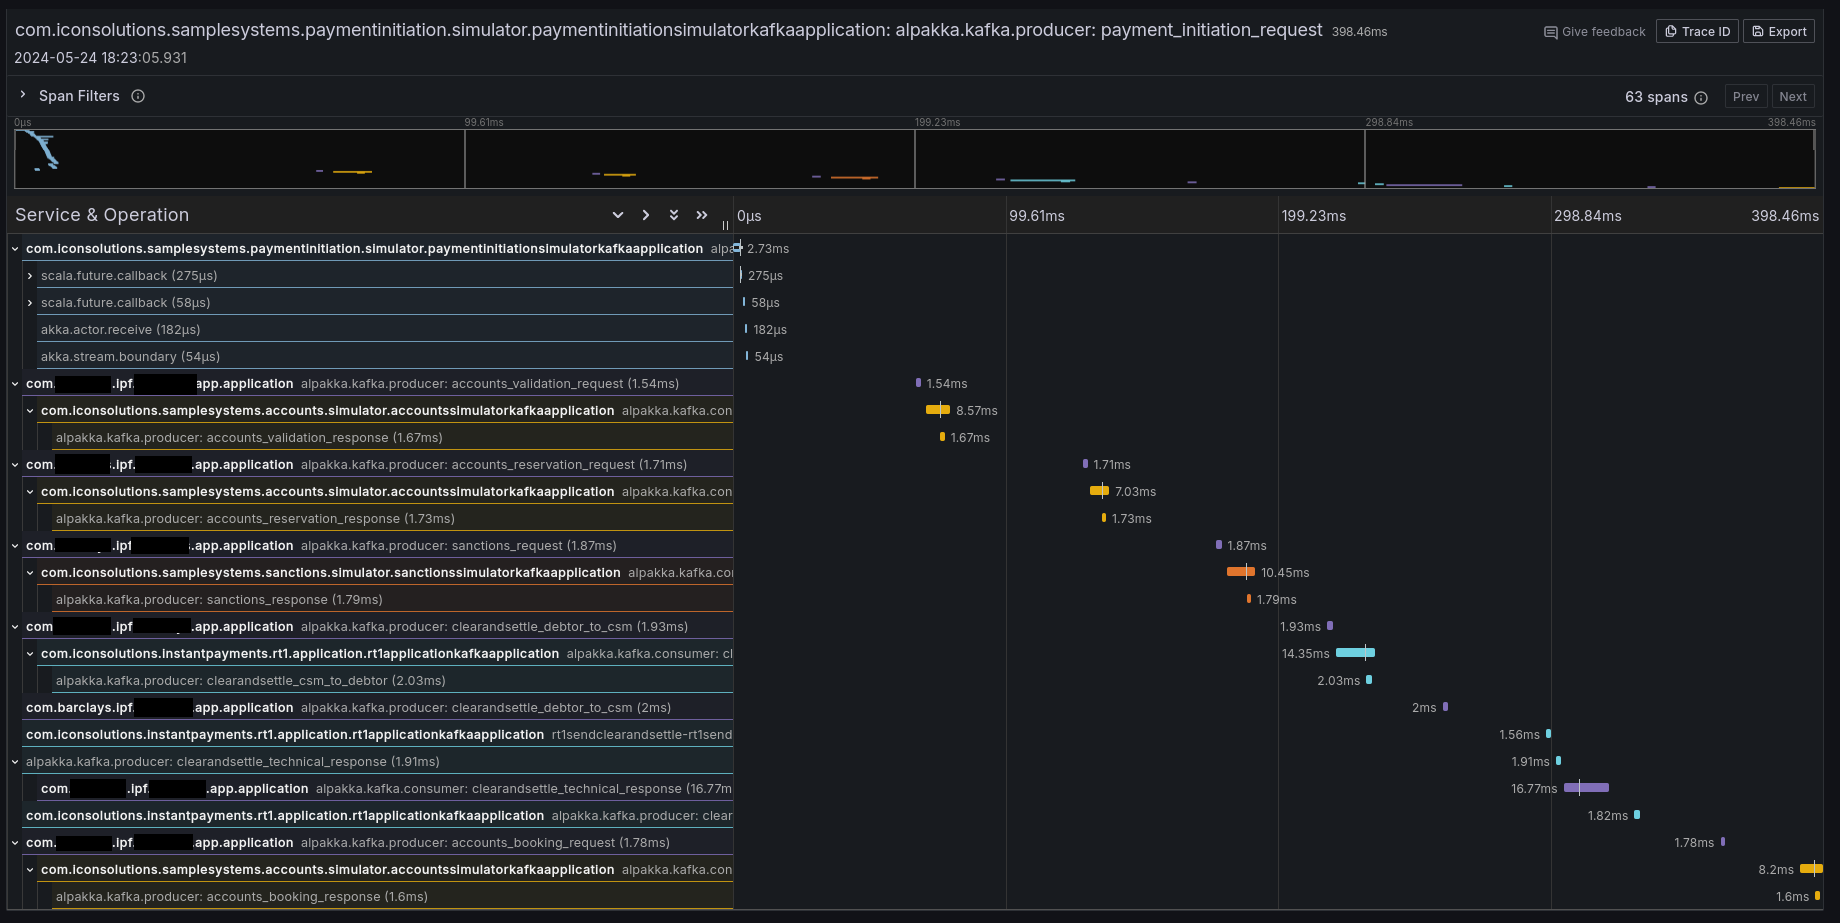
If it all worked correctly then you should see some traces in your preferred tracing tool (e.g. Jaeger, Zipkin, Grafana Tempo):
Context Propagation
It is also possible to configure IPF to simply propagate the relevant headers without creating any additional tracing information. By default, Lightbend Telemetry supports forwarding the following types of context:
| Type | Docs to enable |
|---|---|
W3C Trace Context (default for OpenTelemetry) |
|
B3 (by Zipkin) |
|
AWS X-Ray |
Limitations
Tracing and telemetry in general are generally a zero-code approach: simply enabling the Cinnamon Java agent enables code-level introspection to add the relevant tracing details.
However, Lightbend Telemetry currently only supports Kafka and HTTP. If - at any boundary - messages are going over JMS (or any other protocol that isn’t Kafka or HTTP), the trace context will be lost, and some intervention is required to connect the traces.
To connect the traces, follow the instructions in Inject and Extract
to extract the SpanContext when sending, and injecting it when receiving messages. An example using a modified a
custom CorrelationService could be:
import com.iconsolutions.ipf.core.shared.correlation.CorrelationService;
import lombok.AllArgsConstructor;

@AllArgsConstructor
public class OpenTracingAwareCorrelationService implements CorrelationService {

    private final CorrelationService delegate;

    @Override
    public CompletionStage<Correlation> save(Correlation correlation) {
        var map = new HashMap<String, String>();
        GlobalTracer.get().inject(ActiveSpan.getContext(), Format.Builtin.TEXT_MAP, new TextMapAdapter(map));
        correlation.getSupportingContext().mergedWith(SupportingContext.of(map));
        return delegate.save(correlation);
    }

    @Override
    public CompletionStage<Optional<Correlation>> findByCorrelationId(CorrelationId correlationId) {
        return delegate.findByCorrelationId(correlationId)
                .thenApply(maybeCorrelation -> {
                    maybeCorrelation.ifPresent(it -> GlobalTracer.get().extract(Format.Builtin.TEXT_MAP, new TextMapAdapter(it.getSupportingContext().getMetaData().getValues())));
                    return maybeCorrelation;
                });
    }
}
This CorrelationService implementation will save the active OpenTracing Span into the correlation store where
possible, and extract it where possible.
Note that this will require introducing a dependency on OpenTracing, which is a library that is deprecated in favour of OpenTelemetry. This page will be updated when Lightbend Telemetry is updated to support native OpenTelemetry tracing.
Lightbend Telemetry ("Cinnamon") support for tracing
Note that Lightbend Telemetry ("Cinnamon") does not currently support the OpenTelemetry standard for traces and only implements the legacy OpenTracing protocols. However, luckily, the OpenTelemetry collector and AWS X-Ray support the legacy OpenTracing Zipkin format.