IPF Grafana Dashboards
Overview
This documentation provides details on the pre-configured IPF Grafana dashboards designed for immediate deployment across all environments. These dashboards offer monitoring and insights of selected IPF components and are designed to be easily imported into a existing Prometheus and Grafana environment.
| The Grafana dashboards shown here correspond to the selected IPF release version in these docs. If you have customized dashboards from a previous IPF release version, you’ll need to reapply those changes after upgrading to a newer version. |
Dashboards Included
IPF Flow Metrics
Per-flow statistics on how long flows are taking to be processed from initiation until they reach a final state.
Helps track IPF Flow performance, including flow throughput, flow latency, and timeout metrics.
IPF Connectors
Per-connector statistics on numbers of requests sent, received, and average response times.
Helps track throughput and performance of messages sent and received between IPF services and external services.
IPF System monitoring
Reports on a range of application service metrics to determine the overall health of the IPF ecosystem, and help identify if there has been any degradation of performance over time.
Provides statistics on the JVM from metrics provided by the Spring actuator as well as some Akka entity metrics.
IPF Business Activity Monitoring
A dashboard for the Additional Optional Module IPF Metrics Processor. Tracks information associated with end-to-end payments processed through IPF. Metrics produced include counts and durations of finished, cancelled and failed payments, and counts of error codes. In addition to this, the Metrics Processor supports drilling down into payments using a variety of labels i.e. Payment Type and CSM.
| Requires use of the Additional Optional Module service ipf-metrics-processor |
IPF ODS Ingestion
A dashboard for the Additional Optional Module IPF ODS Ingestion. Statistics relating to the ODS ingestion service reporting on any lag between ingestion of data as well as metrics relating to database persistence and Kafka.
| Requires use of the Additional Optional Module service ipf-ods-ingestion |
Installation
-
Download Dashboard JSON
Use the JSON links above for the specific dashboard you want to integrate into your Grafana monitoring. Save this JSON in a easily accessible place.
Alternatively, the JSON dashboards are available as part of the
ipf-grafana-dashboardsmaven module:<groupId>com.iconsolutions.ipf.grafana</groupId> <artifactId>ipf-grafana-dashboards</artifactId> -
Import Dashboards into Grafana
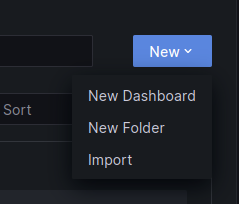
Navigate to Grafana → Dashboards → New → Import.
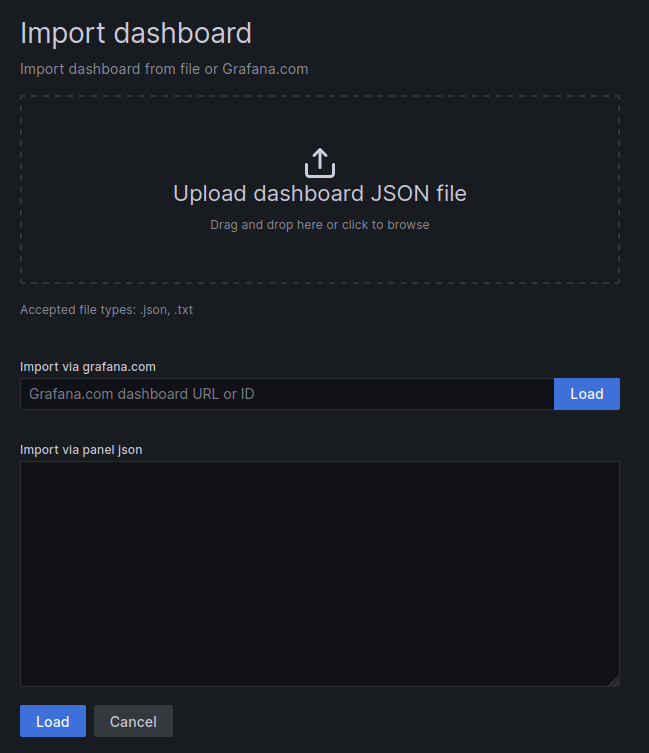
Upload the downloaded JSON files or paste their contents.
-
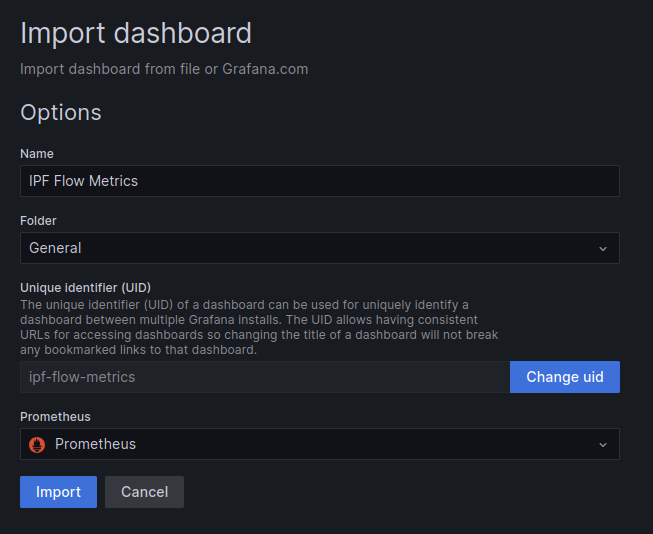
Assign the appropriate Prometheus data sources as needed.
Expectations and Considerations
Existing Grafana and Prometheus setup
These dashboards are designed to be imported into an existing Grafana and Prometheus setup. Ensure that both are properly configured before importing.
IPF Connector default Metrics
The IPF Connectors dashboard is based upon the default connector metrics exposure through Cinnamon (aka Akka Insights, aka Lightbend Telemetry). However, it’s possible to use a different Metrics backend by specifying the MetricsAdapter when creating any type of connector. If customised, the metric names differ depending on the type of implementation used, therefore the underlying queries for this dashboard need to be updated. See the Connector Metrics Documentation for more information.
IPF ODS Ingestion Kafka Dependency
The IPF ODS Ingestion dashboard includes some Grafana panels that rely on Kafka metrics, these panels are titled:
-
Kafka Messages Produced vs Consumed per second
-
Lag by Consumer Group
These metrics are not exposed by IPF applications, they depend on the Kafka Exporter being deployed as part of your environment to expose the necessary Kafka metrics. If this is not possible, the these panels will not be able to render correctly. They can either be safely deleted or, if you have an alternative method of exposing equivalent Kafka metrics, the underlying query of the panels can be updated.