Monitoring and Observability
The strategy on IPF for monitoring and observability is achieved by utilising an event-driven paradigm, strict categorising of application behaviour, and extensibility for exposing this data through appropriate channels, with the best tooling.
Monitoring of IPF application services can be done in three primary ways:
-
HTTP APIs
-
Time-series metrics via Prometheus and Grafana
-
Application logging
Out of Scope:
-
Application performance monitoring (APM) - This is something to consider if such software is available at the customer’s site. APM software such as Dynatrace or AppDynamics can help diagnose potential problems before they materialise.
-
Infrastructure Monitoring e.g. Brokers, containers
Definitions
The "IPF application" is actually comprised of multiple runtime software packages. This section will describe the terminology that will be used herein:
| Component | Sometimes known as | Description | Needs to be in Akka cluster with other similar nodes? |
|---|---|---|---|
Payment Services (Customised) |
Write side |
The set of payment flows that the client has defined. There can be multiple of these representing different sets of flows (e.g. credit transfer, recall, value-added service). |
Yes |
CSM Service |
CSM Pack, Scheme Pack |
An adapter for a payment provider such as an payment scheme, wallet, etc. |
No |
Support Services |
Notification Service |
Additional processing of events to third party systems. |
Yes |
Individual Service APIs (HTTP)
There are certain HTTP APIs that are enabled by default which can be interrogated when the application is running, each serving a specific purpose.
Here’s a summary of those APIs and the configuration items that set their hostnames and ports:
| What is it? | What does it do? | Example use case | API reference (or similar) | Default hostname | Default port | Host override env var | Port override env var | Available on |
|---|---|---|---|---|---|---|---|---|
Spring Boot Actuator API |
Spring Boot style metrics for the JVM, Spring config properties, beans, health |
To verify the version of active libraries |
|
|
|
|
|
|
Akka Management Cluster HTTP API |
Information on the currently running Akka cluster for debug purposes |
To verify cluster state and manually manage nodes |
(the result of |
|
|
|
|
Spring Boot Actuator API
Use this API for inquiring on the Spring ApplicationContext that’s currently running on this particular node. Some interesting Spring Actuator endpoints for IPF:
-
conditions: Check that the write and read side of the application have been configured on the relevant nodes correctly -
env: Display environment variables to check overrides are correct -
health: Useful for liveness probes and the like -
info: General application info (also useful for liveness probes)
More endpoints are available.
Visit the Spring Boot Actuator link in the table above to see all the details.
Also, please note this
particular section on how to enable and disable particular Actuator endpoints (MANAGEMENT_ENDPOINT_X_ENABLED where X
is the relevant Actuator part).
For information on how to configure TLS for the Actuator endpoints, see this section.
Akka Cluster HTTP Management
This API allows the user to interact with IPF’s underlying Akka cluster using an HTTP interface.
The primary use for this API is to verify the cluster state. IPF client implementation components require that all "write" nodes serving the same set of flows (e.g. credit transfer, recall, digital wallet payout) are in an Akka cluster together. If this is not the case, no new work will be taken to avoid losing transactions.
The cluster finds other similar nodes by itself, but in case the application appears to not be consuming any new work, this should be the first port of call to ensure that the cluster is in a valid state and that the application is not in a "split brain" (multiple nodes being created in separate clusters).
Split brain situations can be resolved using the Akka Split Brain Resolver. More information is available on this topic on the Akka website.
The Akka Cluster HTTP Management endpoint also allows for update operations.
If this behaviour is not desired, set the
AKKA_MANAGEMENT_READ_ONLY environment variable to true to enable read-only mode where cluster information can only be retrieved but not updated.
TLS settings for Akka Management are the same as those for Spring Boot, but the server or management.server prefixes are replaced with akka.management.
So for example to set the keystore path, the property would be
akka.management.ssl.keystore or AKKA_MANAGEMENT_SSL_KEYSTORE (the Spring Boot equivalent being server.ssl.keystore
or SERVER_SSL_KEYSTORE).
Time-Series Metrics
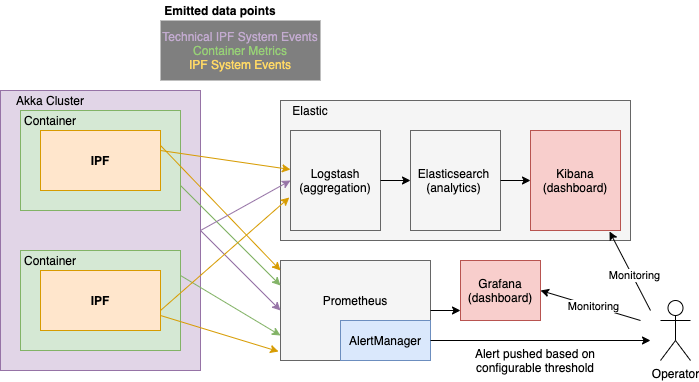
Metrics are exposed via a Prometheus HTTP server which is interrogated over some set interval by Prometheus, and visualised using tools like Grafana and Kibana.
The AlertManager component performs configurable aggregation of events based on thresholds and conditions to translate this system behaviour into something that may need action for an Operator.
Relevant Application Metrics
Aggregated application level metrics are also exposed with the same mechanism:
| Metric name | Type | Description | Event information | Source | ||
|---|---|---|---|---|---|---|
|
Histogram |
Time in seconds that a flow execution takes |
|
Spring Actuator (TCP/8080) |
||
|
Counter |
Total number of invocations |
same tags as used in ipf_behaviour_end_to_end_latency_seconds_bucket |
Spring Actuator (TCP/8080) |
||
|
Counter |
Total time spent by all invocations |
same tags as used in ipf_behaviour_end_to_end_latency_seconds_bucket |
Spring Actuator (TCP/8080) |
||
|
Histogram |
Time spent by flows in that state |
|
Spring Actuator (TCP/8080) |
||
|
Counter |
Total number of calls to that state |
|
Spring Actuator (TCP/8080) |
||
|
Counter |
Time spent by all calls to that state |
|
Spring Actuator (TCP/8080) |
||
|
Gauge |
Number of active flows by state |
|
Spring Actuator (TCP/8080) |
||
|
Histogram |
Times from the moment IPF receives a command until all the side effects complete |
Segmented by behaviour, name of command, previous state, resulting state, call result (success, failure)
|
Spring Actuator (TCP/8080) |
||
|
Histogram |
Time to make a call into IPF, including event persistence time, execution of all side effects and potential retries |
Segmented by behaviour, name of command, call result (success/failure)
|
Spring Actuator (TCP/8080) |
||
|
Counter |
Number of transactions have been created (started) |
|
Spring Actuator (TCP/8080) |
||
|
Counter |
Number of transactions that have reached a terminal (final) state |
|
Spring Actuator (TCP/8080) |
||
|
Counter |
Number of flows that have raised a timeout system event |
|
Spring Actuator (TCP/8080) |
||
|
Counter |
Raised when the IPF domain invokes an action on an external system |
|
Spring Actuator (TCP/8080) |
||
|
Counter |
Raised when an action invoked by IPF has not received a reply within the configured timeout |
|
Spring Actuator (TCP/8080) |
||
|
Counter |
Raised when a Domain Event has been successfully persisted |
|
Spring Actuator (TCP/8080) |
||
|
Counter |
Raised when the IPF domain receives a command that cannot be handled in the current state of the aggregate |
|
Spring Actuator (TCP/8080) |
||
|
Histogram |
which records the duration between the time a domain event has been created and the time it has been sent to ODS; the durations will be sensitive to time skew between the servers, so they should be treated as estimates only |
Spring Actuator (TCP/8080) |
|||
|
Counter |
Count of the total number of domain events sent to ODS |
|
|
Spring Boot Dashboards
Basic JVM metrics via the prometheus Spring Boot Actuator endpoint.
There are several dashboards that can be used to visualise this data, but we recommend this one from the Grafana dashboard collection.
Akka Dashboards
There are some out-of-the-box Grafana metrics that are available for Akka, documented and available for download here. The interesting Akka dashboards to look out for - as far as IPF is concerned - are:
-
Event Sourced Behaviours: Metrics on events and command being processed by IPF flows
-
Akka Streams and Akka Streams (extended): Connector stream processing performance metrics
IPF Specific Dashboards
There are also some custom IPF-specific dashboards which are available:
| Name | Description | Required Data |
|---|---|---|
|
Per-connector statistics on numbers of requests sent, received, and average response times per connector. |
|
|
Per-flow statistics on how long flows are taking to be processed from initiation until they reach a final state. |
|
|
Reports statistics on the connector circuitbreakers using metrics defined in Resilience4J. |
|
|
Provides a few statistics on the JVM, for example heap memory, per pod in the cluster. For a more detailed dashboard see |
|
|
Reports on any the request/response metrics of CSM simulators that are deployed in the cluster. |
Requires a |
|
Reports on a wide range of application service metrics (MongoDB/Akka…) to determine the overall health of the IPF ecosystem, and help identify if there has been any degradation of performance over time. |
|
|
Statistics relating to the ODS ingestion service reporting on any lag between ingestion of data as well as metrics relating to Kafka/MongoDB. |
Pod name is assumed to be Kafka consumer group for ingress is assumed to be called Kafka egress topic is assumed to be called |
|
Reports on statistics based on flow metrics to show transactions in completed or non-completed states |
Completion state name is assumed to end with the word |
|
Reports on Event Sourced Behaviours (ESBs) action and input metrics providing the rate of execution between these functions. |
|
|
Provides detailed statistics on the JVM from metrics provided by the Spring actuator. |
|
|
Provides overall and per-connector metrics on request and response timings. |
Requires a |
Working Example of Using PromQL to Generate a Custom Graph
Requirement
A pie-chart to represent all the CSM completion states of all transactions that happened in this calendar day that took less than the SLA of 5 seconds.
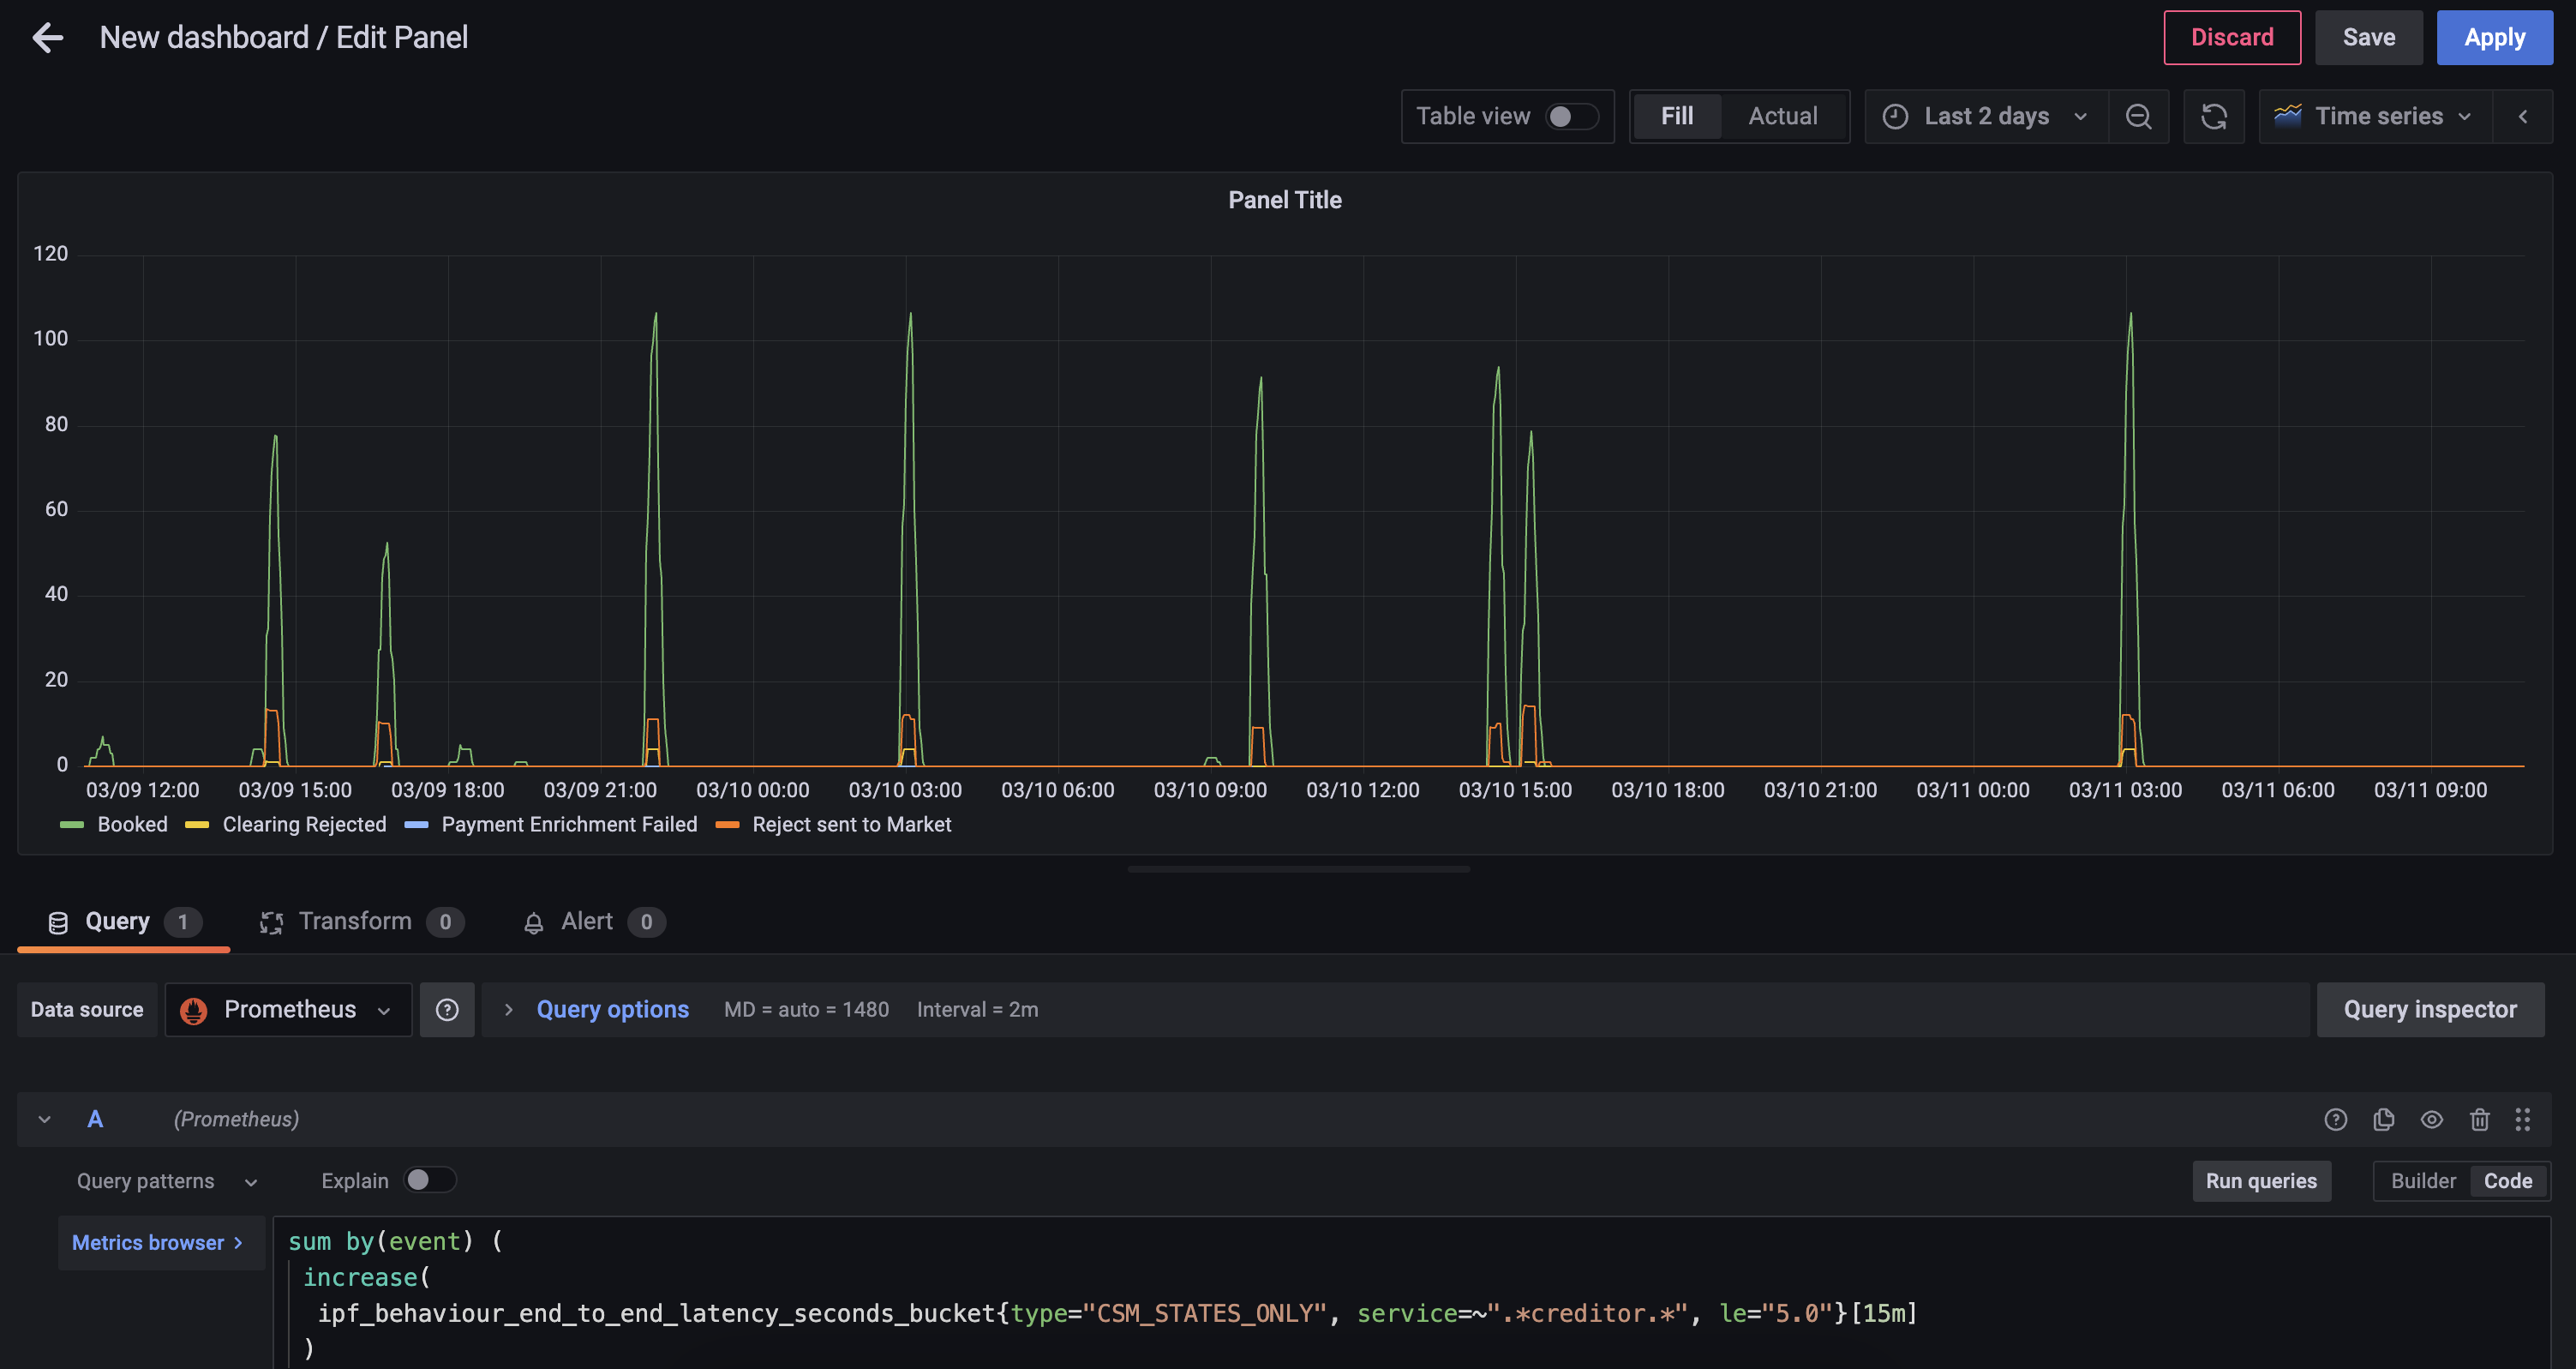
Step 1 - Choice of Metric
First you should find the closest metric that would provide the data required, in this case the ipf_behaviour_end_to_end_latency_seconds histogram data should work.
sum by(event) (
 increase(
  ipf_behaviour_end_to_end_latency_seconds_bucket{type="CSM_STATES_ONLY", service=~".*creditor.*", le="5.0"}[15m]
 )
)
This query will return the number of states completed in 15 minute interval grouped by event
-
increase- calculates the increase in the time series in the range vector -
sum- calculates the total in the time series
Further PromQL functions that can be used can be found here.
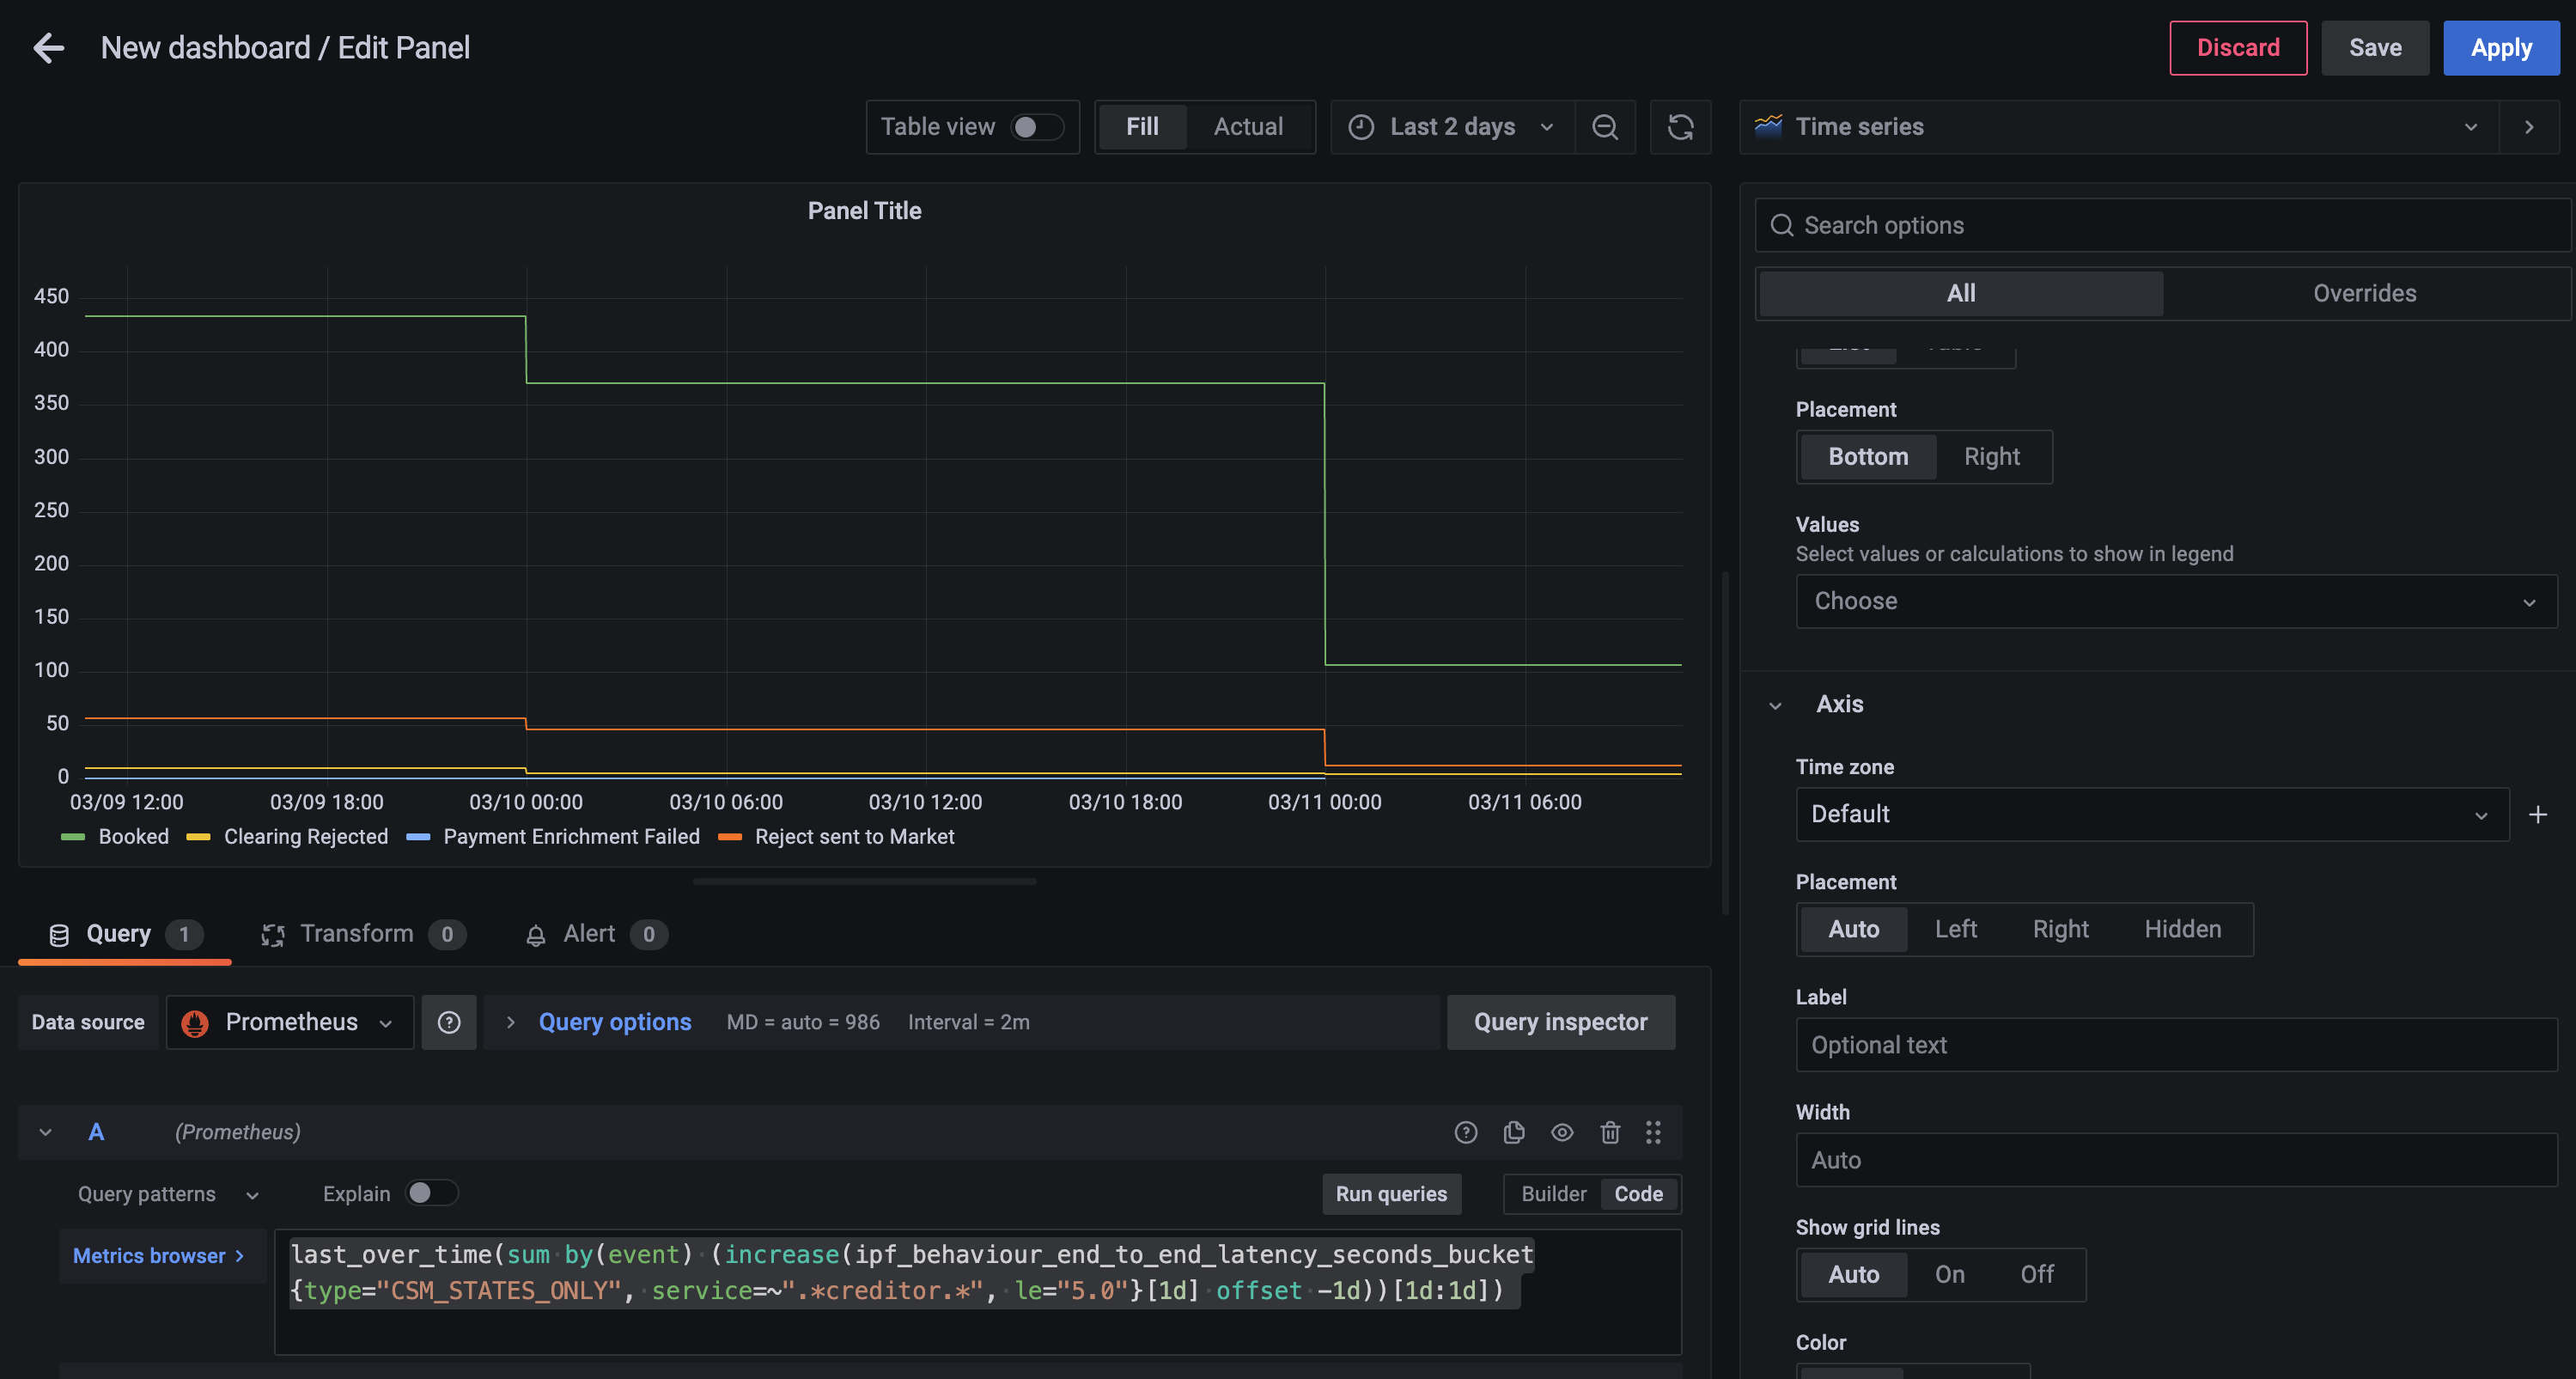
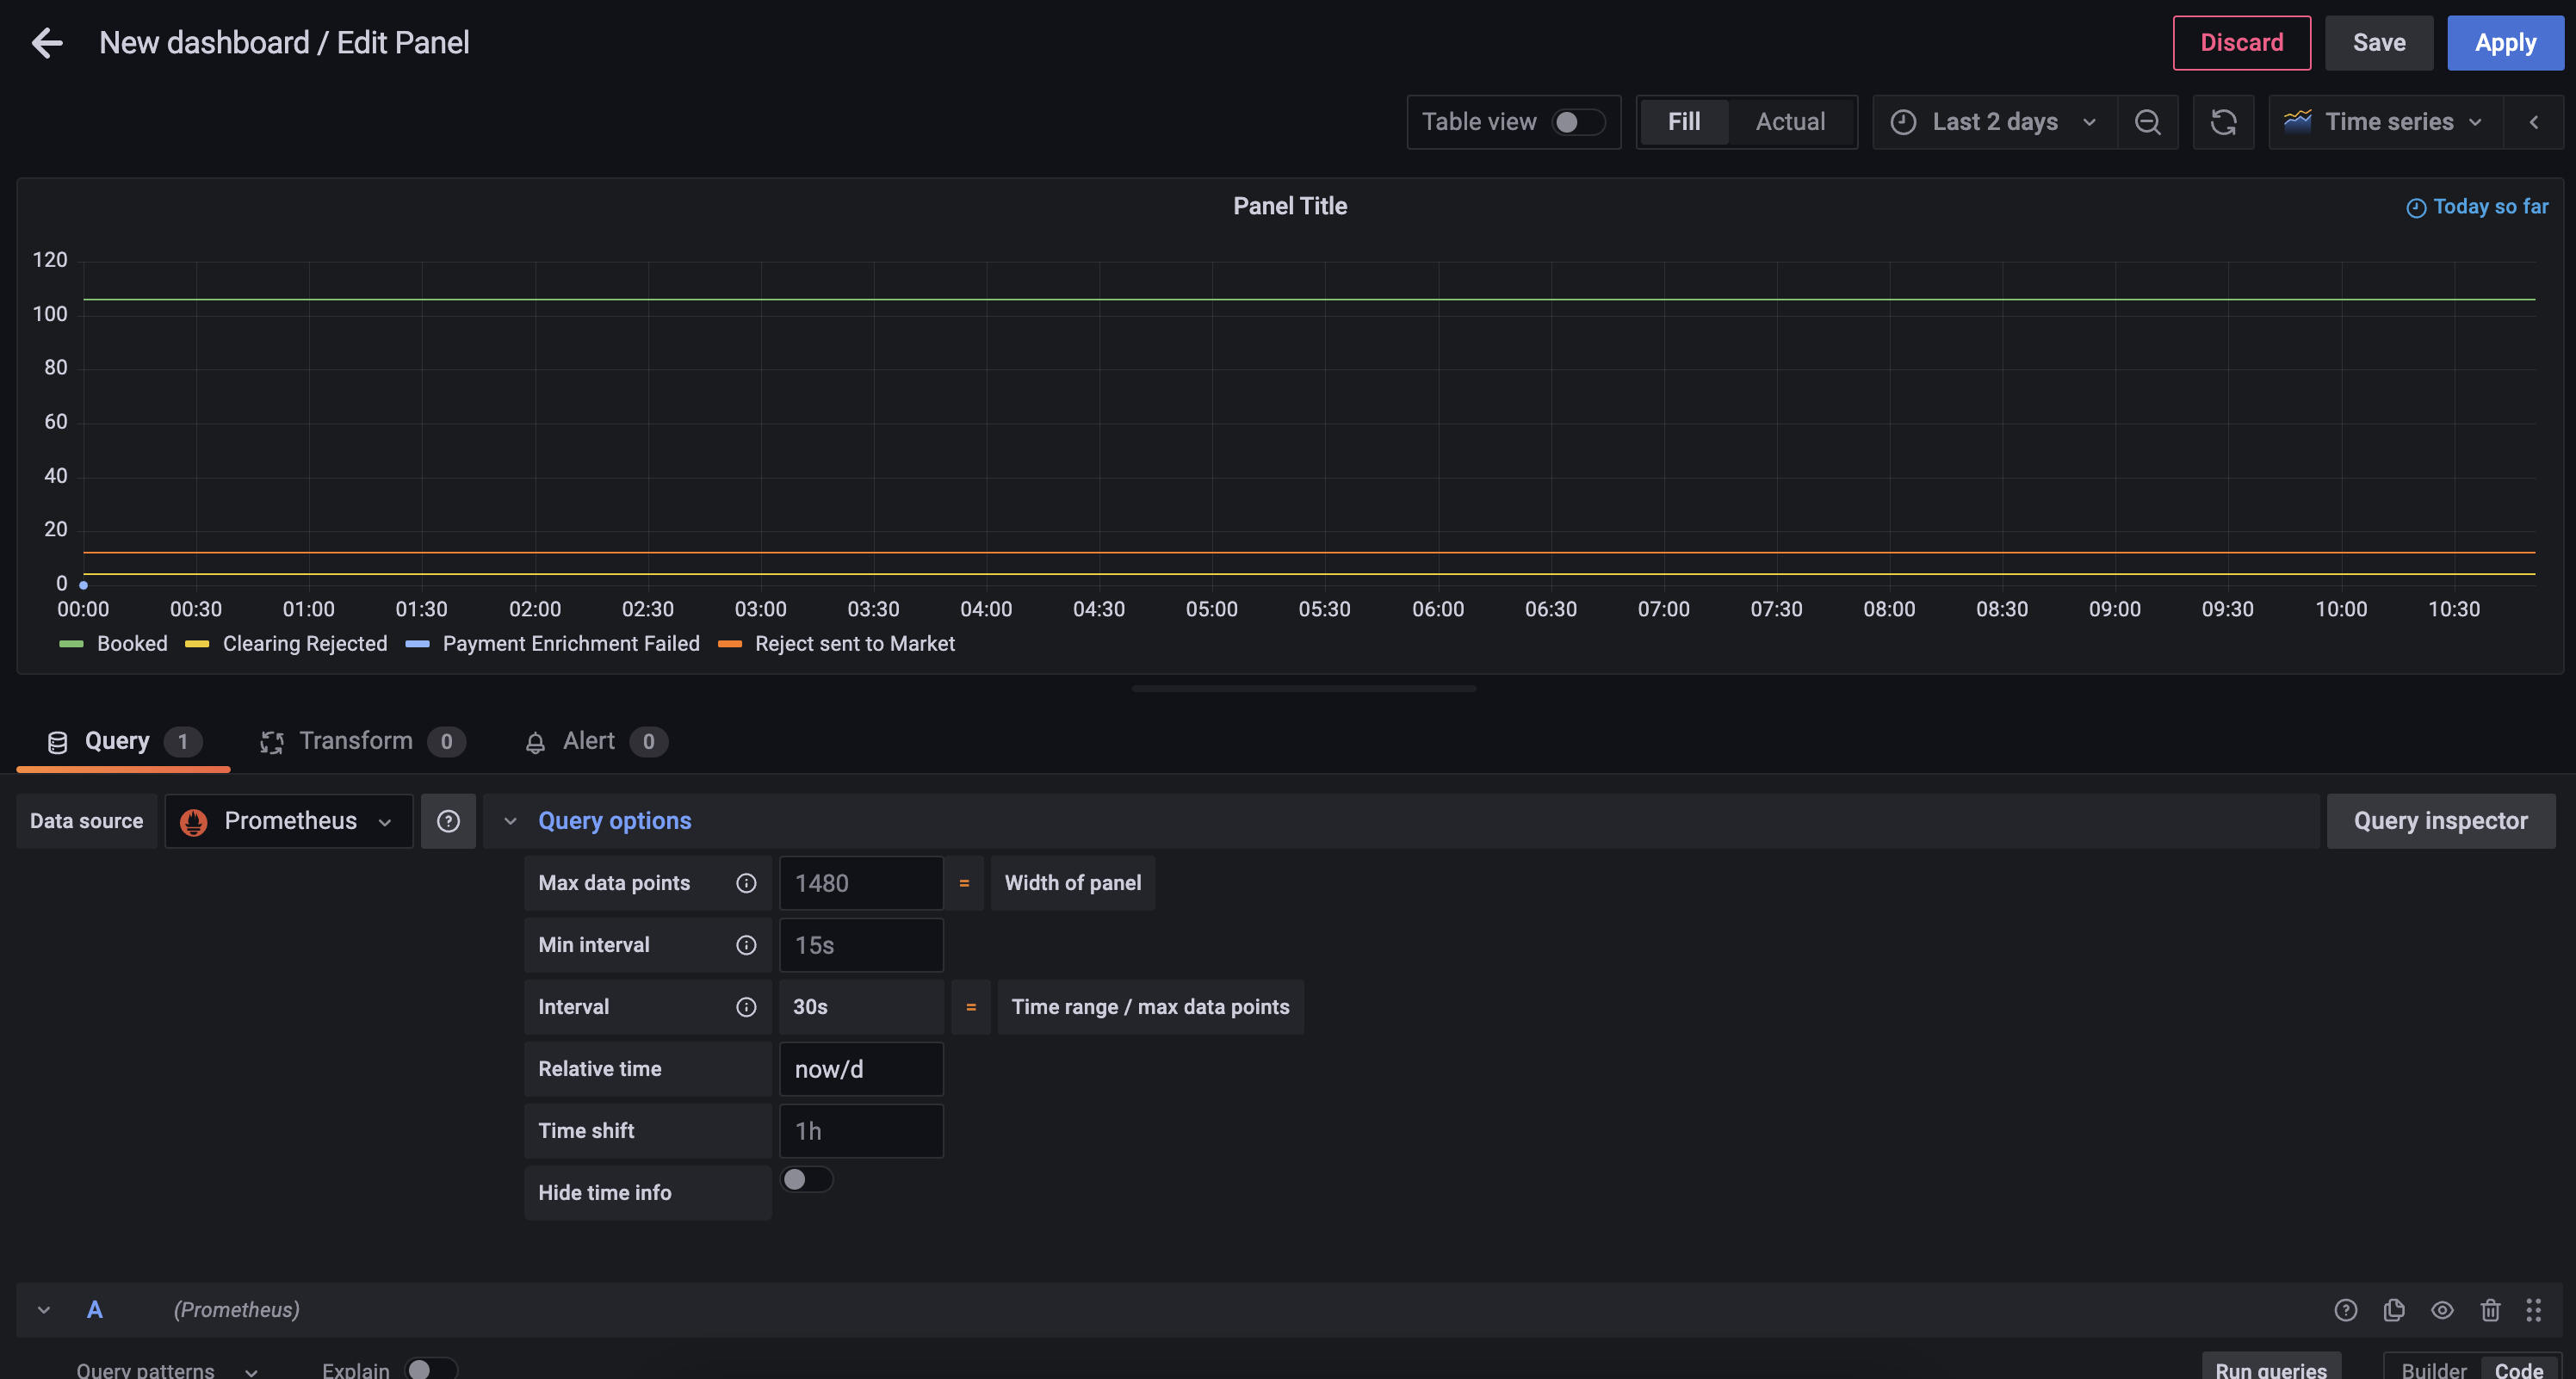
Step 2 - Grouping into Days
Now you can create a daily today with the following query
last_over_time(
 sum by(event) (
  increase(
   ipf_behaviour_end_to_end_latency_seconds_bucket{type="CSM_STATES_ONLY", service=~".*creditor.*", le="5.0"}[1d] offset -1d
   )
  )
 [1d:1d]
)-
last_over_time- the most recent point value in specified interval
Step 4 - Change the Graph Style
Using the Visualization picker on the right hand side, choose the Pie Chart option, and alter the Title to Calls to Scheme.
You will also be able to add the following changes:
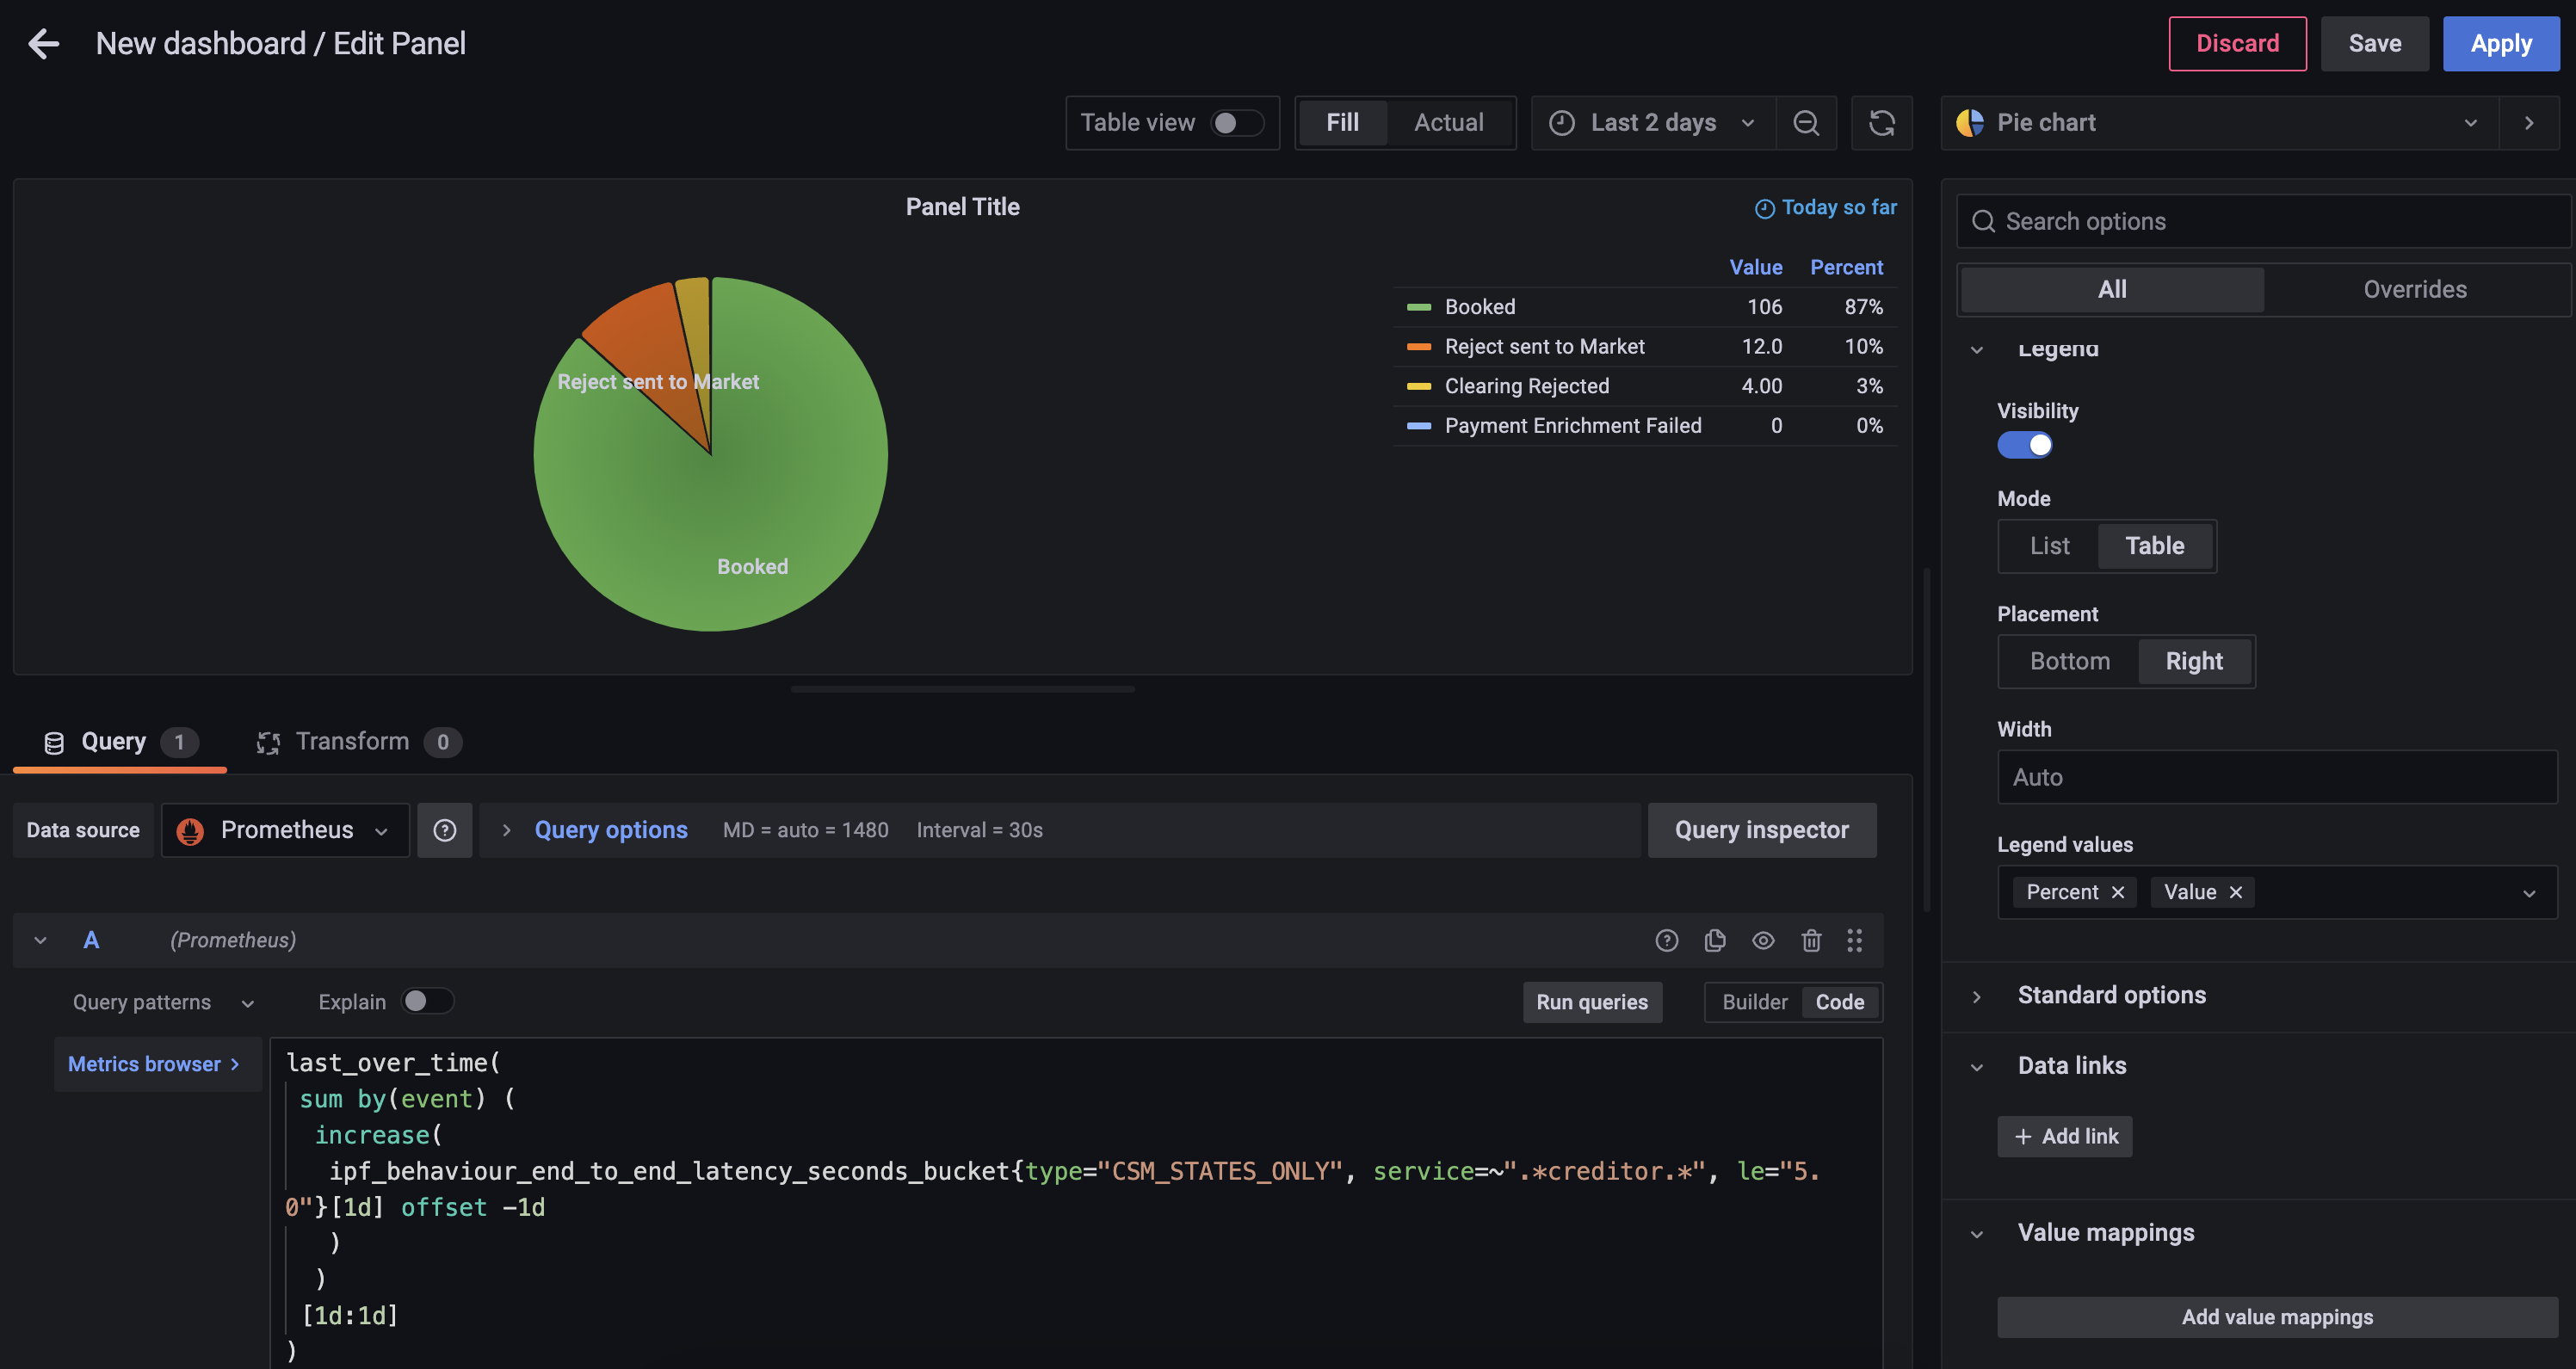
-
Add Piechart labels of
Name -
Change Legend mode to
Table, set placement toRightand add Label Values ofPercentandValue
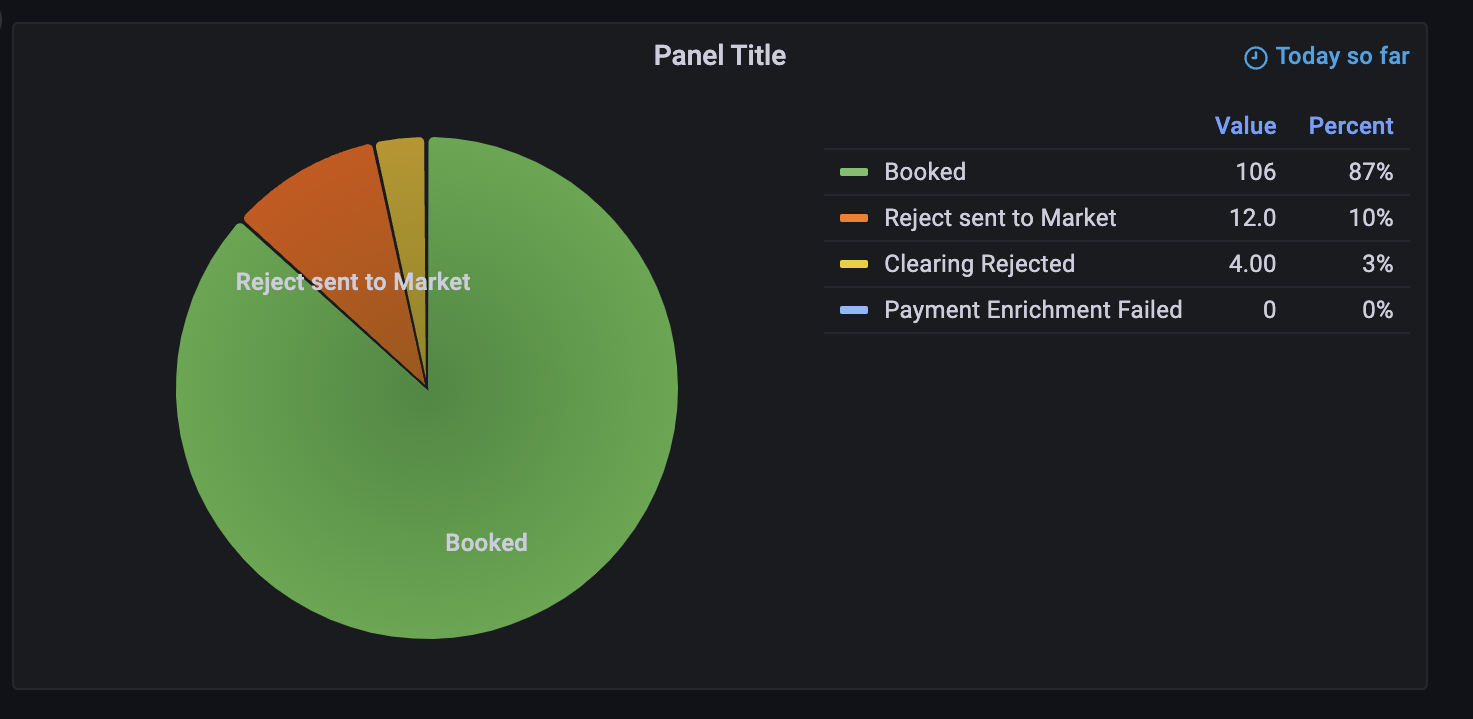
You can now save the dashboard which will then look something like
Exporter Configuration
Spring Boot Actuator metrics are exposed via the same Actuator HTTP server documented above. See above for how to change the Actuator host and port.
Both Akka and IPF-specific Prometheus metrics are available on the same Prometheus exporter web server, which by default is configured to listen on all interfaces (0.0.0.0) and port 9001.
To change these details, the relevant environment variables are:
-
CINNAMON_PROMETHEUS_HTTP_SERVER_HOST -
CINNAMON_PROMETHEUS_HTTP_SERVER_PORT
If these properties are changed, remember to also change the Prometheus side so that Prometheus can collect time-series data from the correct address(es).
Logging
IPF uses Logback for logging configuration. This allows the user to configure a logging setup which can mirror that of other applications developed inside the organisation, and make IPF report log data in the same way.
This document will explain some typical logging setups which can be used to output log data in various ways.
For all setups, the Logback configuration file needs to be mounted on the app’s classpath.
For an Icon-built image, this is always available at /[name of container]/conf.
So if the container is named credit-transfer, then the Logback configuration can be mounted at /credit-transfer/conf/logback.xml.
Option 1: Elasticsearch/Logstash/Kibana
A popular stack in the industry is ELK: a combination of Elasticsearch, Logstash (and/or Beats) and Kibana. It was formerly known as the ELK stack, but with the introduction of Beats, Elastic have been pushing the more generic "Elastic Stack" naming for this setup.
Either way, the setup looks like this:
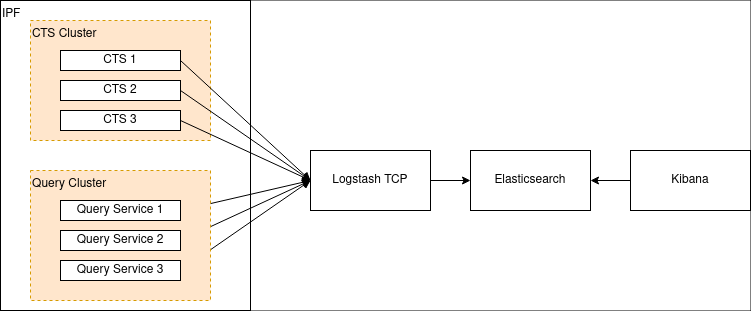
First we need to configure Logstash to listen to a TCP port. Here’s an example of how to configure that in Logstash:
input {
    tcp {
        port => 4560
        codec => json_lines
    }
}
This makes Logstash listen on port 4560 for lines of JSON separated by the newline character \n.
The Logstash Logback appender does this for us, and can be configured like so:
<?xml version="1.0" encoding="UTF-8"?>
<configuration>
  <appender name="stash" class="net.logstash.logback.appender.LogstashAccessTcpSocketAppender">
      <destination>127.0.0.1:4560</destination>
      <encoder class="net.logstash.logback.encoder.LogstashAccessEncoder" />
  </appender>

  <appender-ref ref="stash" />
</configuration>
This will configure IPF application logs to be sent to Logstash. Configuring Logstash to connect to Elasticsearch (and Kibana to Elasticsearch) is out of scope of this document but can be found on the Elastic website here.
More examples, including:
-
Configuring TLS over the TCP connection, and;
-
A UDP variant of the appender
Can be found on the Logstash Logback appender’s GitHub page here.
Configuring a Logstash Appender for System Events
If you wish to aggregate IPF system events, consider using the com.iconsolutions.payments.systemevents.utils.Slf4jEventLogger
which forwards all received system events to an appender.
This can be used in conjunction with this Logstash appender to push system events to an aggregator such as Elasticsearch as mentioned above.
Here’s an example Logback config which takes Slf4jEventLogger events and sends them to our STASH appender:
<logger name="com.iconsolutions.payments.systemevents.utils.Slf4jEventLogger" level="DEBUG" additivity="false">
    <appender-ref ref="STASH"/>
</logger>
Option 2: Splunk
Aside from a specific setup such as the one above, a true twelve-factor app should output its logs - unbuffered - to
stdout, and this can be analysed by software such as Splunk.
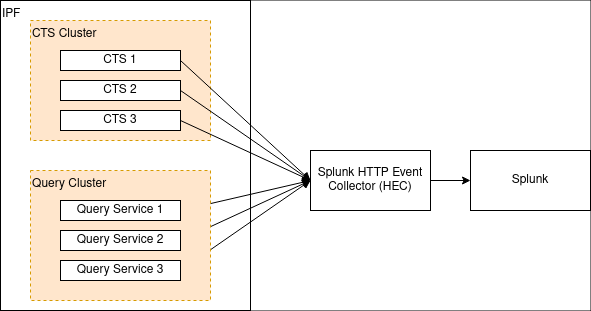
Splunk provides an HTTP appender for Logback. This is documented here. That document also outlines some performance considerations for logging with HTTP, and also a TCP appender which can be used instead of HTTP.
The Logback template referred to in that document can be found here.
There are three mandatory fields:
-
url: The Splunk URL to forward to -
token: The token provided by Splunk for authentication and authorisation -
index: The Splunk index (repository) for storing this log data
Option 3: Files (Not Recommended)
|
Logging to file breaks cloud-native principles about not making assumptions about an underlying file system. Logs should be treated as data streams instead of files that need maintaining. Only use this approach as a last resort when it’s absolutely not possible to use a more modern approach for logging. For more information please see XI. Logs on the Twelve-Factor App. |
It is possible to specify a normal Logback file appender.
A typical logback.xml might look like:
<?xml version="1.0" encoding="UTF-8" scan="true"?>
<configuration>
    <jmxConfigurator />
    <appender name="FILE"
              class="ch.qos.logback.core.rolling.RollingFileAppender">
        <file>/opt/ipf/logs/credit-transfer-service.log</file>
        <rollingPolicy class="ch.qos.logback.core.rolling.FixedWindowRollingPolicy">
            <fileNamePattern>/opt/ipf/logs/credit-transfer-service.log.%i</fileNamePattern>
            <minIndex>1</minIndex>
            <maxIndex>20</maxIndex>
        </rollingPolicy>
        <triggeringPolicy class="ch.qos.logback.core.rolling.SizeBasedTriggeringPolicy">
            <maxFileSize>50MB</maxFileSize>
        </triggeringPolicy>
        <encoder>
            <pattern>%date{yyyy-MM-dd} %d{HH:mm:ss.SSS} %-5level %X{traceId} %logger{36} %X{sourceThread} %X{akkaSource} - %msg%n</pattern>
        </encoder>
    </appender>

    <root level="INFO">
        <appender-ref ref="FILE" />
    </root>
</configuration>
This file creates the following configuration:
-
The logfile is parsed for live changes every minute (
scan="true"). -
Logging configuration can be modified live with JMX. More information on this is available here.
-
File logging to
/opt/ipf/logs/credit-transfer-service.log. -
Files rolled over to
/opt/ipf/logs/credit-transfer-service.log.n, where n is a number between 1-20, and is rolled over whencredit-transfer-service.logreaches 50 MB. Note that only 20 such files (i.e. a total of 1 GB of log data) will be kept.
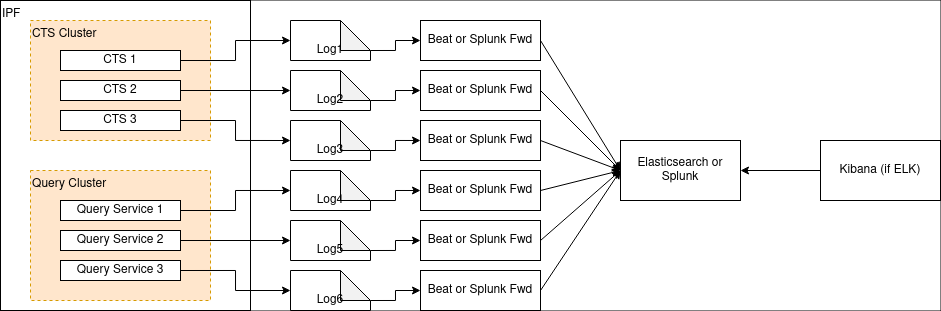
This file can also be scraped by a framework such as Splunk forwarder or Beats as shown in the diagram below:
System Events
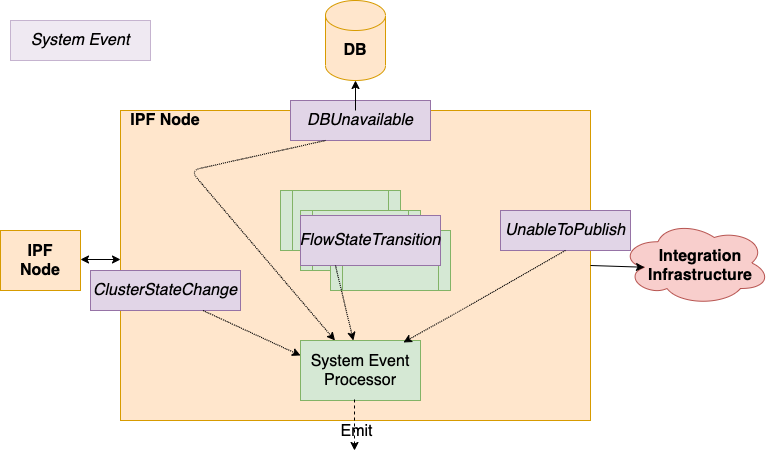
What are IPF System Events
-
IPF applications are underpinned by a System Event framework, providing pub/sub capabilities between application components.
-
Hierarchical, extensible, versioned, catalogued. All application areas: Technical, Functional & Lifecycle. All events include common properties: Source location, Creation time, Level, Type, association context, simple to get all System Events for a given payment
-
The fundamental data framework for capturing application behaviour, providing a place to build extensible event-driven functionality, which can then be feed into supporting tasks such as providing data for monitoring and alerting.
-
System Event processors subscription pattern : "Act on all WARN level Infrastructure System Events”.
-
Configure multiple processors, functional style, store /transform – emit over a Connector.
-
All the System Events that an IPF Service may emit are catalogued and have a schema, they are versioned against the deployed software.
-
New client-specific events are encouraged to be added for a given Solution. Providing a very clean extension for leverage the existing framework and providing additional data insights.
Where they are Defined
The full list of system events that IPF produces are listed here.
Troubleshooting Error Messages
The events in this table are ERROR events logged by IPF and describe recommended remediation steps to follow if encountered.